KARTING
DYNOMOMETERS
Printer-friendly format
PART 6 - Interpreting the Data
Story
and Photos by John Copeland
|
By
now you're probably wondering when the heck we're going to stop
fooling around on this dyno business and tell you what all those
numbers really mean. Well, your patience is rewarded this month.
This time we're going to take a look at some real data,
corrected for environmental conditions like we learned last
time, and figure out what it's telling us about the engine and
how to set it up before we go to the track. We'll use a 5HP
stock class Briggs, but the principles are pretty much the same,
4-cycle or 2-cycle.
One
of you correctly pointed out that the dyno data we used last
month to illustrate proper data correction did not reflect the
entire usable range of RPMs available to the average Briggs
racer. Right you are! It turns out that the data I used was
taken for a specific dirt-track setup where, once the
green flag dropped, the clutch was never a factor. Consequently,
the engine builder in this example was concentrating on getting
the most out of the engine beginning in a higher RPM range. To
help you get a clearer picture of how to transfer the numbers on
the dyno to your track setup, we'll use data that starts at a
lot lower RPM, 4000 RPM to be specific. The Corrected Data is
shown in Figure 1.
|
| ENGINE
NAME |
1 |
DATE |
APR
23, 96 |
| TYPE |
BRIGGS |
TIME |
10:25
AM |
| SERIAL
# |
#12345 |
TEMP |
80 |
| CAM |
DYNO
95-5 |
HUMIDITY |
70 |
| HEADER |
990
x 15 |
BAR.
PRESS. |
29.5 |
|
|
CORRECTION
FACTOR 1.0774 |
|
|
|
|
| RPM |
TORQUE |
HORSEPOWER |
CHT |
| 4000 |
9.14 |
6.96 |
363 |
| 4100 |
9.18 |
7.17 |
363 |
| 4200 |
9.19 |
7.35 |
365 |
| 4300 |
9.21 |
7.54 |
367 |
| 4400 |
9.26 |
7.76 |
366 |
| 4500 |
9.13 |
7.82 |
364 |
| 4600 |
9.00 |
7.88 |
362 |
| 4700 |
8.98 |
8.04 |
361 |
| 4800 |
8.88 |
8.12 |
359 |
| 4900 |
8.79 |
8.20 |
357 |
| 5000 |
8.67 |
8.25 |
356 |
| 5100 |
8.52 |
8.27 |
359 |
| 5200 |
8.71 |
8.62 |
359 |
| 5300 |
8.68 |
8.76 |
354 |
| 5400 |
8.61 |
8.85 |
352 |
| 5500 |
8.34 |
8.73 |
352 |
| 5600 |
7.94 |
8.47 |
351 |
| 5700 |
7.76 |
8.42 |
350 |
| 5800 |
7.53 |
8.32 |
350 |
| 5900 |
7.34 |
8.25 |
349 |
|
|
|
|
Figure
1
|
It
will probably be helpful to look at this data in graphic form as well. We'll
graph only the Torque and Horsepower and exclude the CHT for now. See Figure
2.
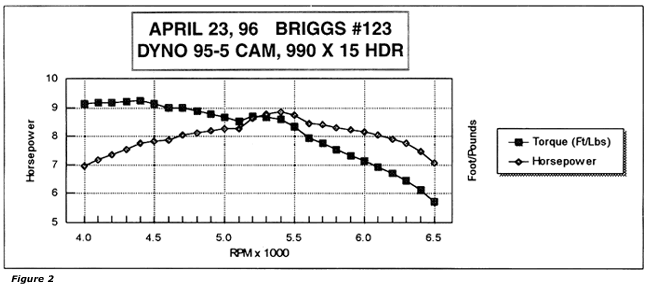
A
close examination of the data table confirms what we see on the graph; namely
that Torque peaks at 4400 RPM and Horsepower peaks at 5400 RPM. Also please
note that the CHT also peaks at about the same RPM as the Torque peak. This is
the point at which the engine is performing most efficiently. Remember, the
engine is converting the majority of its fuel energy into heat energy; lower
heat probably indicates less complete combustion. Of course, if the heat is
way out of whack with the Torque curve, jetting is probably not correct.
You've
probably also noticed the little "hiccup" in both the Torque and the
horsepower curves at about 5200 RPM. You'll see this sort of data, both in 4-cycles
and in 2-cycles, somewhere in the transition phase between middle and high
RPM. It reflects changes in airflow characteristics through the carb and the
engine, fuel pickup changes, and, in some 4-cycles,
certain cam/lifter behaviors. In any case, what is this data
telling us?
For
openers, experience has taught us that clutch engagement is generally best at
200 to 300 RPM below Torque peak; 4100 to 4200 RPM in this case. That allows
for solid clutch hookup before the torque begins to fall off. Setting the
clutch at or above the Torque peak may, in some cases, cause the clutch to
"chatter" as the hookup drops the RPM slightly and the clutch can no
longer develop the needed pressure to engage solidly. This is not to say that
there are not occasions where a higher clutch engagement won't work, but in
general 200-300 RPM below peak works well. What can we tell about gearing from
this data? Well, depending on your race track, you're going to have some
options about the usable RPM range. You'll note that, overall, Torque drops
steadily as RPM goes up. At some point you want to limit the top end RPMs with
gearing just because you're tapping into a diminishing resource. You've heard
people say how their engine just doesn't "pull" on top end? Remember
"pull" is basically a torque effect. If your engine doesn't want to
"pull" on top, you need to lower those top end RPM with gearing
until it does. At a local short track where it's a struggle to gain more than
1500 RPM on the longest straight, you're going to need plenty of gear to try
to get to that 6000 RPM figure. But never forget that, in this example, the
Torque is falling off pretty hard from 5400 on, so if you have any elevation
changes to negotiate, headwinds on the straight, etc., you're better off to
take teeth off to get down more into the "meat" of the Torque curve.
A special example of this is 4-cycles running at enduro events on big tracks.
Where aerodynamics becomes the limiting factor on top end, you'll generally go
faster if you gear to keep the top RPMs lower, like 5500 RPM, where you still
have enough Torque to drive you though the wind resistance.
 |
So
this dyno run has given you several valuable bits of data: Where
is the Torque peak so I can better judge where to set the clutch
engagement? What happens to Torque and Horsepower at higher RPMs
so I can adjust my gearing accordingly? And how close is this
fuel/air mixture, based on the relationship of CHT to Torque?
Finally, we now also have a baseline to compare this engine
setup to other engines or other setups on this engine. |
A
serious dyno program is a tremendous tool. It can give you a completely
unbiased look at the slightest change in your engine setup. We ran this same
engine a few minutes later, changing just the header. Look at figure 4 for
this data. Look to figure 3 for the graph.
| ENGINE
NAME |
1 |
DATE |
APR
23, 96 |
| TYPE |
BRIGGS |
TIME |
10:55
AM |
| SERIAL
# |
#12345 |
TEMP |
65 |
| CAM |
DYNO
95-5 |
HUMIDITY |
52% |
| HEADER |
RBTSON
96C |
BAR.
PRESS. |
30.0
IN Hg |
|
|
CORRECTION
FACTOR 1.0774 |
|
|
|
|
| RPM |
TORQUE |
HORSEPOWER |
CHT |
| 4000 |
9.25 |
7.04 |
324 |
| 4100 |
9.29 |
7.25 |
325 |
| 4200 |
9.30 |
7.44 |
325 |
| 4300 |
9.32 |
7.63 |
327 |
| 4400 |
9.34 |
7.82 |
327 |
| 4500 |
9.37 |
8.03 |
328 |
| 4600 |
9.40 |
8.23 |
328 |
| 4700 |
9.38 |
8.39 |
328 |
| 4800 |
9.29 |
8.49 |
327 |
| 4900 |
9.20 |
8.58 |
327 |
| 5000 |
8.98 |
8.55 |
326 |
| 5100 |
8.87 |
8.61 |
326 |
| 5200 |
8.78 |
8.69 |
324 |
|
|
It
may be tough to get much detail from the graphs in the size that they can
appear here. But if you look at the tables, you'll see that changing headers
did a couple of things. First of all, we've shifted the Torque peak from 4400
RPM to 4600. And at 4600 RPM, the peak is a bit higher too. However, at the
upper RPM range, the Torque falls off pretty hard, resulting in lower
Horsepower from 6000 RPM on up. And take a look at the CHT readings.
For
some reason its header is generating cooler cylinder head temps by about 40
some degrees. We'd sure want to try a jet change next to see what happens if
we push the CHT back up where it was with the other header.
|
|
Figure 4
|
But,
on the basis of just these two runs, if we were running a track that put
a premium on lower RPM performance, a track where you rarely needed to
run over 6000 RPM, we'd sure want to give this header a try. Pretty
neat, huh?
Well,
that's about it for this month. Next time we'll start to wrap all this
dyno business up and talk about how to successfully transfer what you
learn from the dyno to the race track.
Remember,
just because you don't have a dyno of your own doesn't mean you have to
be out of the loop. Lots of good engine builders have serviceable dynos
of various sorts.
You can either contract for dyno time with them, or at
the very least try to get all the information you can about what they've
learned in their dyno studies. The kind of information that can be
gained from a good dyno program shouldn't separate the "chosen
few" from the rest of us karters. Each shop
and engine builder should share it with their customers so they can run better and have
more fun. So let's get going!
About
Us | Karts | Parts |
Schedules | Resources | Contact
|
